.jpg?fit=max&auto=format&n=E2LlsT5gBITvo732&q=85&s=ec11e1673894bdf46663a5d73602eb87)
Using Chrome Developer Tools
The Google Chrome web browser includes Developer Tools, a feature that helps web developers debug issues with HTML, CSS, and JavaScript:- To access Developer Tools on Microsoft Windows or Linux, press Ctrl+Shift+I.
- To access Developer Tools on Apple macOS, press Option+Command+I.
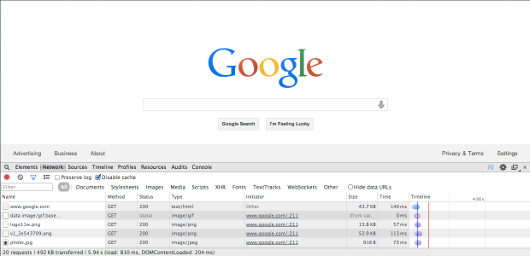 On the Network tab of the Developer Tools pane, Chrome lists all connections for the current page. To test a specific page, open Developer Tools and navigate to the page you want to test. Alternatively, if you want to test the current page, simply refresh the page.
Chrome displays information for each page resource and its request:
Name: The name or URL of the requested resource.
Method: The HTTP method (GET or POST).
Status: The HTTP status code returned by the server.
Type: The MIME type of the resource.
Initiator: The referer sent to the server; this is usually the URL of the page you are viewing.
Size: The size of the resource as received by the browser (if the page was compressed by the server, this value is smaller than the actual filesize).
Time: The total time to retrieve the resource, including DNS lookup and download time.
Timeline: The timeline is a “waterfall” time-lapse view of each request. If you hover your mouse pointer over a bar on the waterfall, a tooltip appears with a detailed breakdown of the download time:
On the Network tab of the Developer Tools pane, Chrome lists all connections for the current page. To test a specific page, open Developer Tools and navigate to the page you want to test. Alternatively, if you want to test the current page, simply refresh the page.
Chrome displays information for each page resource and its request:
Name: The name or URL of the requested resource.
Method: The HTTP method (GET or POST).
Status: The HTTP status code returned by the server.
Type: The MIME type of the resource.
Initiator: The referer sent to the server; this is usually the URL of the page you are viewing.
Size: The size of the resource as received by the browser (if the page was compressed by the server, this value is smaller than the actual filesize).
Time: The total time to retrieve the resource, including DNS lookup and download time.
Timeline: The timeline is a “waterfall” time-lapse view of each request. If you hover your mouse pointer over a bar on the waterfall, a tooltip appears with a detailed breakdown of the download time:
- Blocking: This includes time for the DNS lookup, SSL handshake, and making a connection to the server.
- Sending: This includes time to send the request with all request data to the server, and to receive confirmation from the server that it has received the request.
- Waiting: This includes time for the server to render the content to be served, and to start sending it to the browser.
- Receiving: This includes the time it takes to download the content.
Sometimes the server starts sending content before it is done generating it. For example, a PHP script can start sending HTML, even though it is still dynamically generating page content. This type of scenario can lead to incorrect wait time measurements.
- load: This event is the time to load the page, including all of the JavaScript, CSS, and image files that are in the original HTML document. This event generally takes longer than the DOMContentLoaded event.
- DOMContentLoaded: This event represents the perceived time by a user to load the page. It is the time to render the page as described in the original document before JavaScript requests additional resources. This time is stored when the browser fires the DOMContentLoaded event in JavaScript. (An example of a resource that is requested outside of the DOM is Google Analytics.)