Monitoring the MySQL database for WordPress using Query Monitor
Learn how to monitor WordPress database performance to minimise site errors and downtime. This article shares the steps to monitor database performance for the WordPress database using the Query Monitor plugin.
Monitoring MySQL databases for a WordPress site can be a difficult task for many. The Query Monitor plugin helps ease the database monitoring task by allowing developers to view and debug slow-performing queries in real time. This article gives you the quick steps to install the Query Monitor plugin.
What is the Query Monitor plugin?
Query Monitor feature rich plugin focusing on displaying useful information like aggregate database queries by functions, plugins and themes to developers. This plugin allows developers to debug database queries, PHP scripts and stylesheets and many more.
How to install and configure Query Monitor plugin
To install and configure Query Monitor plugin, follow these steps:
-
Log in to your WordPress site with an administrator account
-
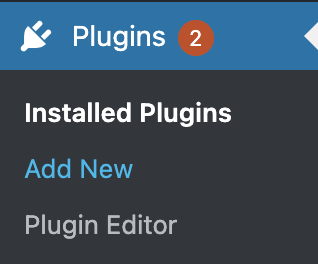
On the Dashboard in the left sidebar, click Plugins, and then click Add New:
-
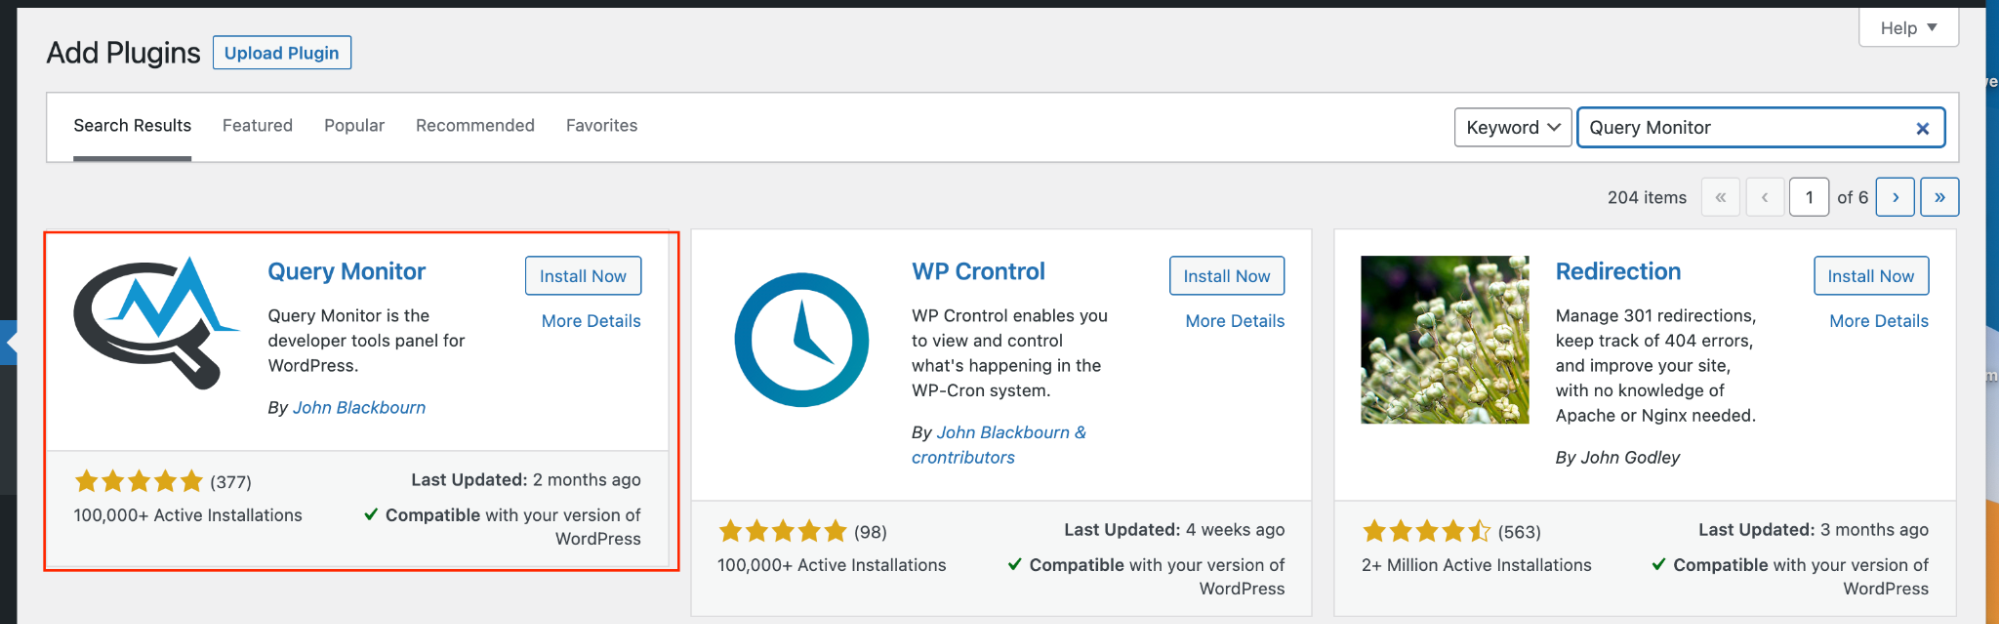
Search for "Query Monitor" and, you should see a display of available plugins on your screen:
-
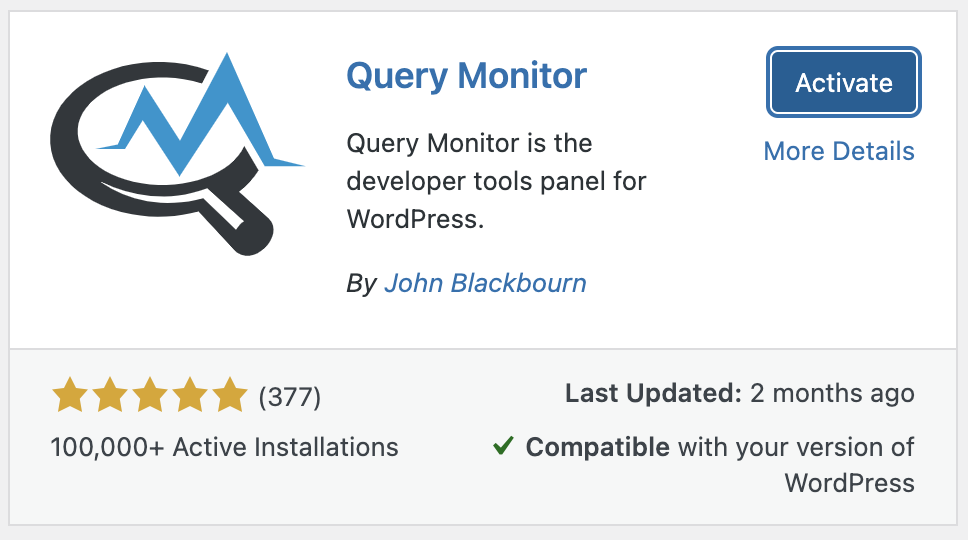
Click Install and then Activate the plugin:
-
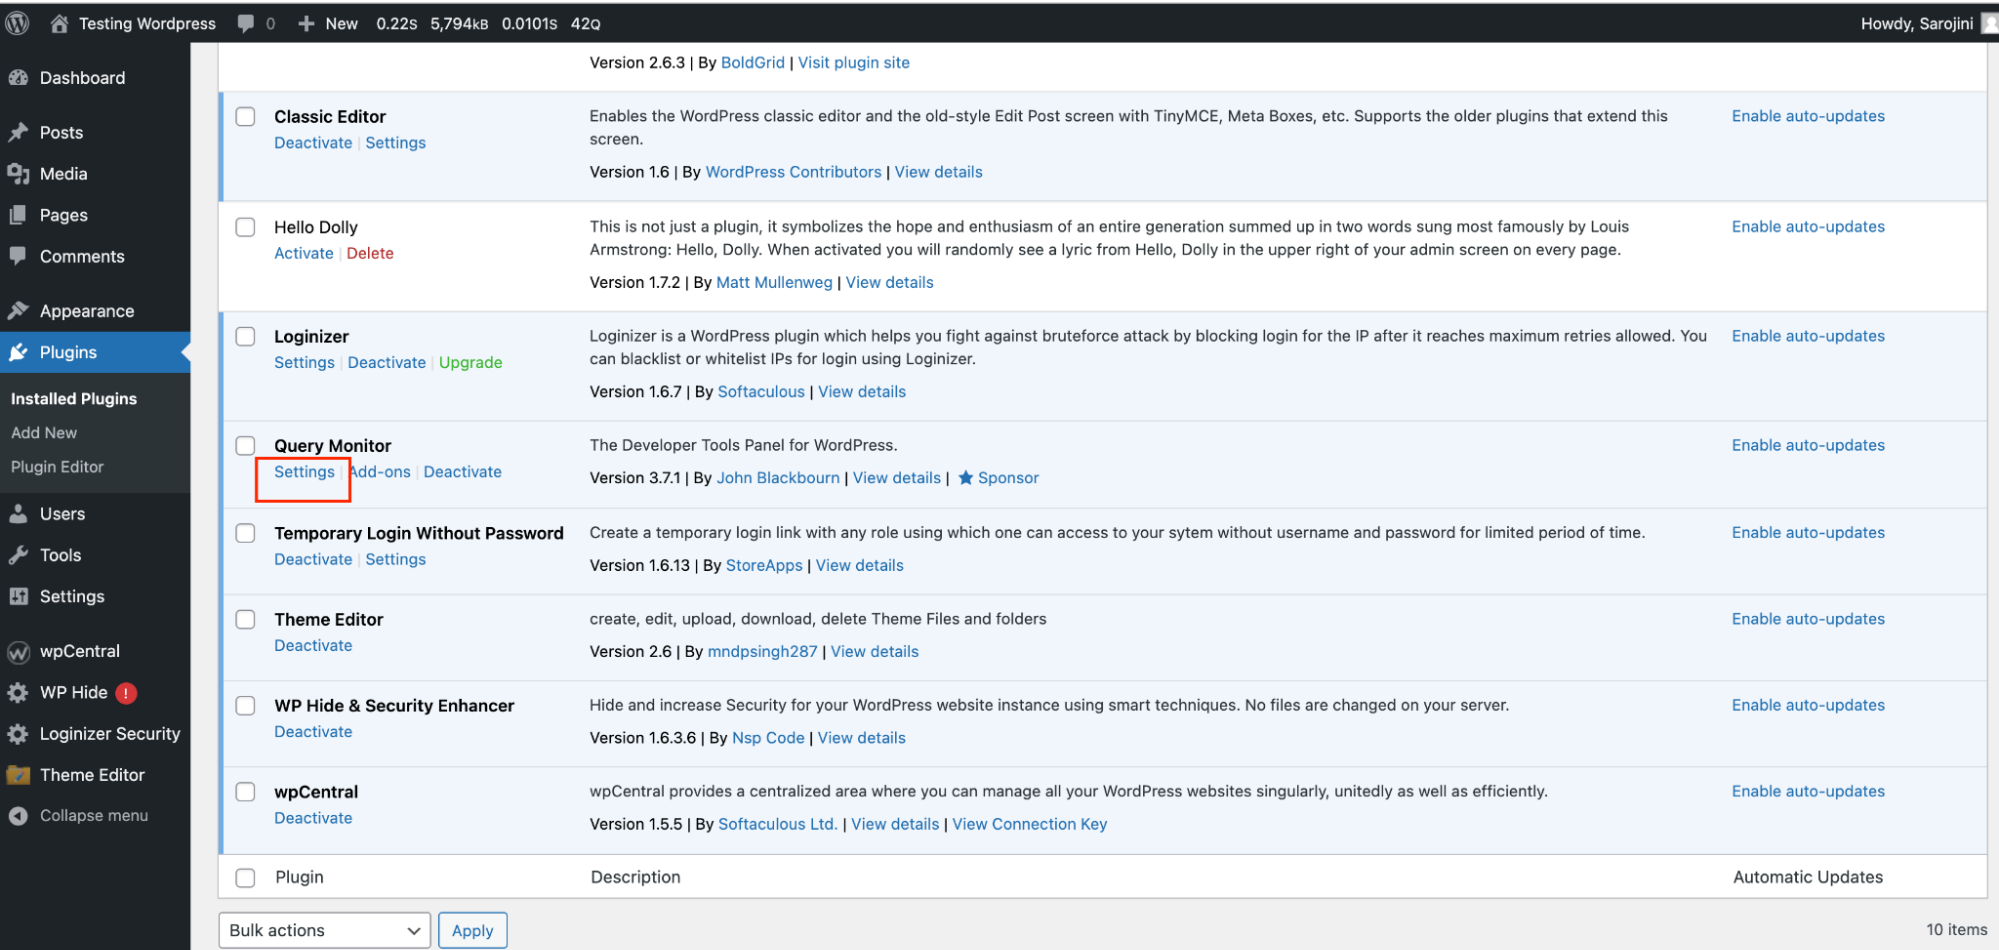
On the Dashboard in the left sidebar, click on Plugins, then click on Installed Plugins. Search for Query Monitor and click on Settings:
-
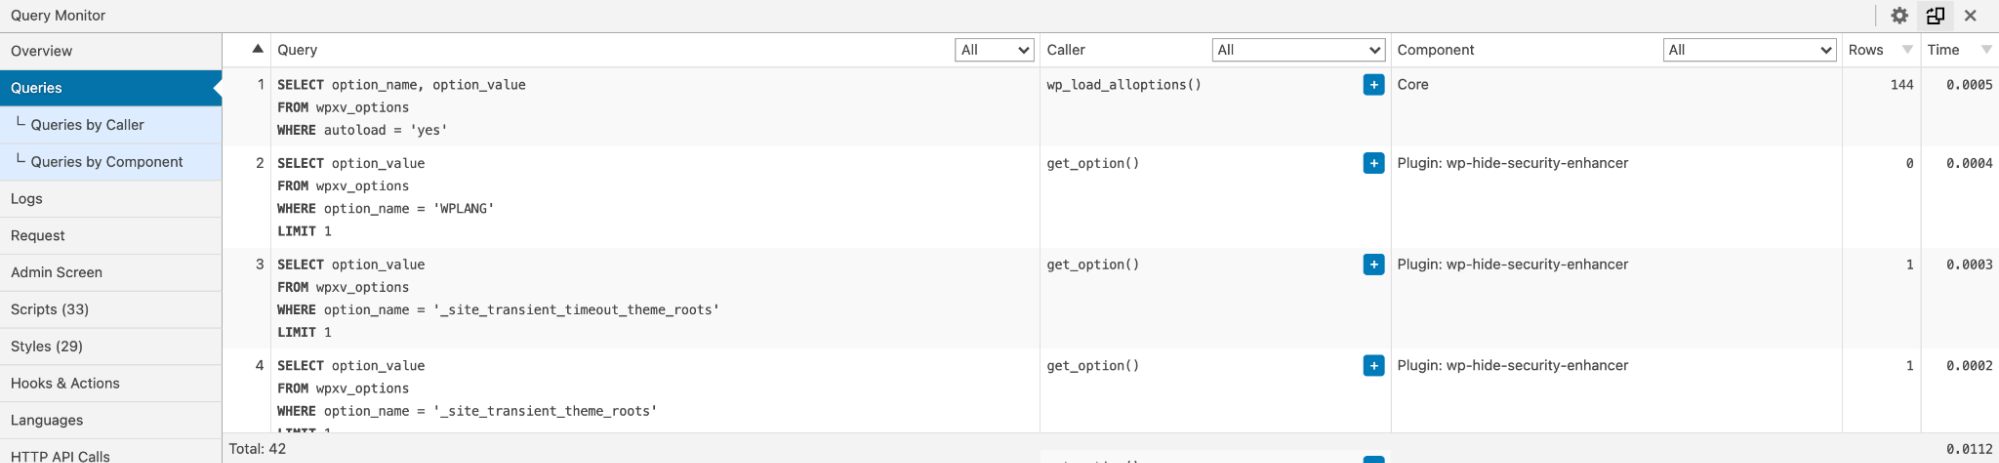
The Database Monitor will be displayed at the bottom of the screen. On the screen, you will be able to see API Calls, database queries, memory usage, and more information related to the performance of your database:
More information
For more information about the Query Monitor plugin please visit: https://wordpress.org/plugins/query-monitor/