Enabling debugging and error log in WordPress
Learn how to enable debugging mode and error log in WordPress with a simple lines of script.
Occasionally, your site may encounter a plugin conflict or other difficulty that prevents it from loading or accessing the Administration Dashboard. WordPress error logs may assist you in determining the source of problems on your site; but, in order to generate those logs, you must enable a feature called Debugging Mode, which by default is disabled for security reasons. Debugging mode will generate a file containing a list of all error messages encountered on your site.This tutorial will walk you through the process of enabling debugging in WordPress.
Enabling debugging mode in WordPress
To enable debugging in WordPress, follow these steps:
-
Log in to cPanel.
-
Note
If you do not know how to log in to your cPanel account, please see this article.
-
In the FILES section of the cPanel home screen, click File Manager:
-
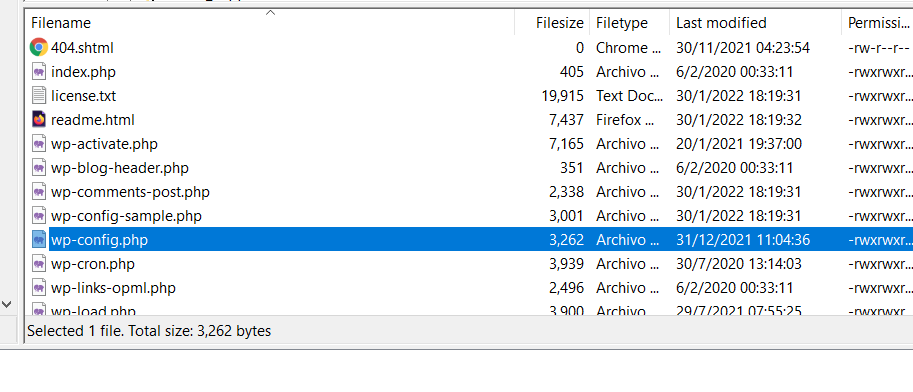
In the left sidebar, click the name of the directory that you want to open. The directory's contents appear in the right pane.
-
Locate the wp-config file in the WordPress installation directory:
-
Open the wp-config.php file in your preferred IDE or text editor.
-
Add the following lines at the end of the file:
define( 'WP_DEBUG', true );
define( 'WP_DEBUG_LOG', true );
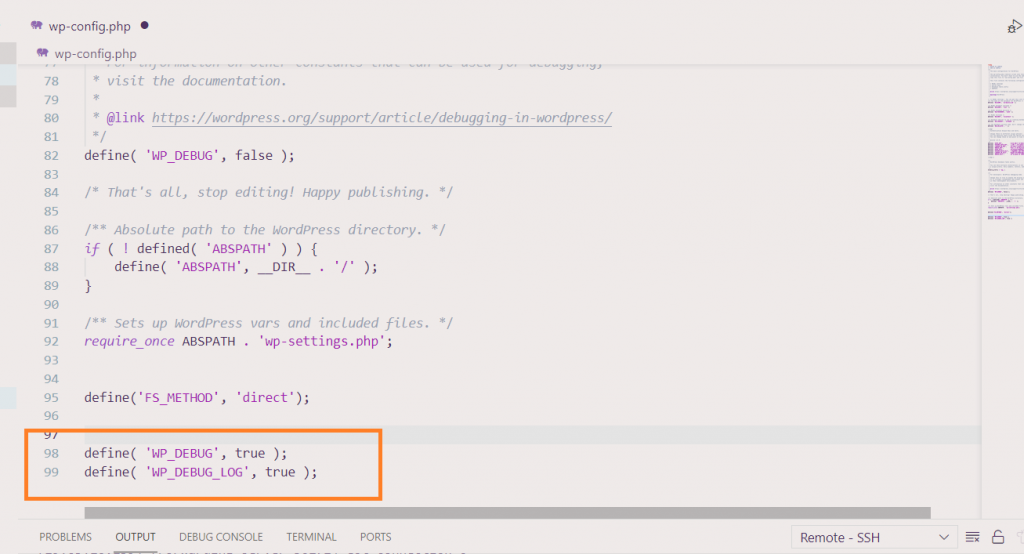
- Save the changes. WordPress will now log all errors in the wp-content folder in a file called debug.log. Keep in mind that debug mode will not prevent the dreaded white screen of death, but it will assist you in identifying the offending plugin or theme.
More Information
For more information about error logging and file manager, please visit:
Related Articles
Updated 3 days ago