Viewing resource usage information in Plesk
Plesk enables you to view your account's resource usage, including CPU, physical memory, and more.
This article describes how to view resource usage information in Plesk.
NotePlesk is no longer included with new hosting.com plans, but it is still available on legacy Managed WordPress accounts. You can install Plesk manually on unmanaged VPS and Dedicated servers.
Viewing resource usage
To view resource usage information in Plesk, follow these steps:
-
Log in to Plesk.
NoteIf you do not know how to log in to your Plesk account, please see this article.
-
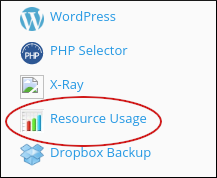
In the right sidebar of the Plesk home screen, click Resource Usage:
-
After a few moments, the resource usage dashboard appears. Depending on your account's resource usage, you may see:
-
Your site had no issues in the past 24 hours: If you receive this message, your account did not trigger any limits within the past 24 hours.
-
Your site has been limited within the past 24 hours: If you receive this message, your account triggered at least one resource limit within the past 24 hours. Plesk displays additional information about which resource (or resources) triggered the limit.
-
Your site might hit resource limits soon: This message is a warning that your account may trigger resource limiting in the near future. Plesk displays additional information about which resource is at risk of triggering a limit.
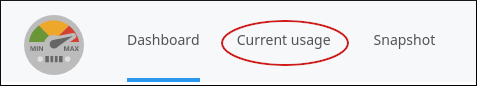
- To view detailed resource usage information for your account, click the Details button or click the Current Usage tab:
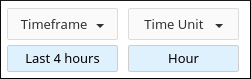
Plesk displays usage graphs and a usage table for the current day. To change the time interval displayed, in the Timeframe list box, select the range of time to be displayed. In the Time Unit list box, select the interval between the data points to display:
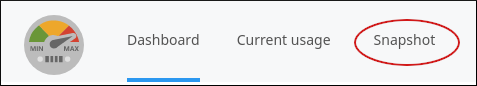
- To view a resource usage snapshot, click the Snapshot tab:
Depending on your account's resource usage, cPanel may display a list of processes and a list of HTTP queries:
-
Use the arrow buttons to view snapshots in sequence.
-
Use the calendar list box to select a specific date to view.
-
Use the Choose Snapshot list box to select a specific snapshot to view.