Viewing and filtering logs in Plesk
Learn how to view and filter logs in Plesk, with detailed instructions on performing multiple functions to view the most recent data on your website.
Plesk offers a versatile and easy-to-use log viewer. Follow the instructions below to access the log viewer and filter the entries.
NotePlesk is no longer included with new hosting.com plans, but it is still available on legacy Managed WordPress accounts. You can install Plesk manually on unmanaged VPS and Dedicated servers.
Step 1: View the logs
To view the logs in Plesk, follow these steps:
-
Log in to Plesk.
-
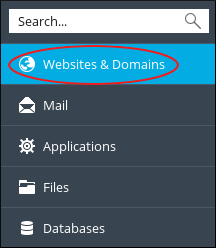
In the left sidebar, click Websites & Domains:
-
If you have more than one domain on the server, scroll to the management area for that domain, and then click Logs:

The Logs page appears, showing the most recent activity.
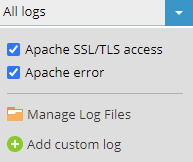
- By default the Logs page displays all of the available logs. The Apache SSL/TLS access and Apache error logs are available here. To choose the log or logs to view, click the down arrow to the right of the All logs list box, and then select or clear the checkbox to the left of the log name:
Step 2: Filter the logs
You can filter logs by Date, visitor IP address,HTTP status code or HTTP message:

-
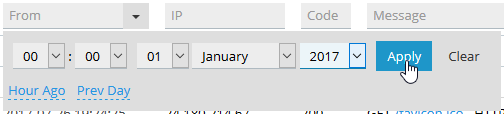
To filter by date, click the down arrow at the right of the From field. Use the date and time controls to select the oldest date that you want to appear in the results. Click Apply when you are done. In the example shown below, only entries from 2017 or later will be shown. To remove date filtering, click the Clear button.
-
To filter by visitor IP address, type all or part of an IP address in the IP text box. When you type a partial IP address, log entries will be shown if any part of the IP address matches the entry. In the example below, 10. matches10.1.1.1, but also matches192.168.210.1.
-
To filter by HTTP status code, type all or part of a status code in the Code text box. When you type a partial code, log entries will be shown if any part of the status code matches the entry. In the example below, 5 matches all of the 5xx Server Error codes, but also matches codes305 and 405.

-
To filter by HTTP message, type all or part of a message in the Message text box. When you type a partial text message, log entries will be shown if any part of the message matches the entry. In the example below, POST is followed by a space and a forward slash to help limit the filtered entries to POST messages. Without the space and forward slash, any entry that contains the stringpost would be included in the results.

-
You can combine any of these filter criteria to achieve the exact results you want.
Step 4: View the most recent data
The Logs page offers two ways to view the most recent data:
-
To update the view continuously as new visitors browse the site, click Start real-time updates at the upper left of the Logs page. The caption on the button changes to Stop real-time updates. To stop real-time updates, click Stop real-time updates.
-
To update the log display with the latest information without continuous updates, click Refresh.
More information
For more information about Plesk, please visit https://www.plesk.com.