Site visitor statistics
The hosting.com Dashboard contains a comprehensive set of statistics about your site’s visitors. With these statistics, you can gain valuable insights into your site’s visitors. To do this, follow these steps:- Log in to the Hosting Panel at https://my.hosting.com.
-
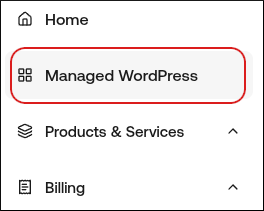
In the left sidebar, click Managed WordPress:
-
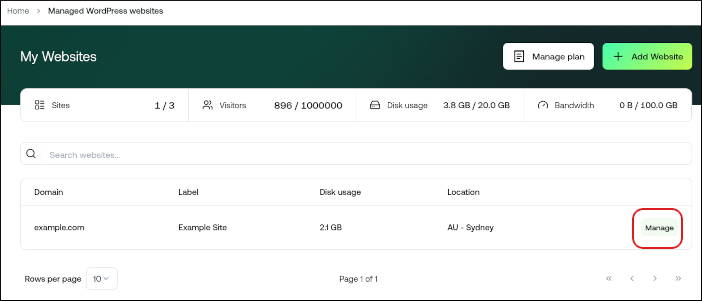
On the My Websites page, locate the site, and then click Manage:
-
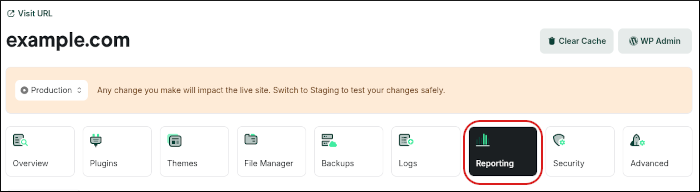
On the hosting.com dashboard, click the Reporting icon:
-
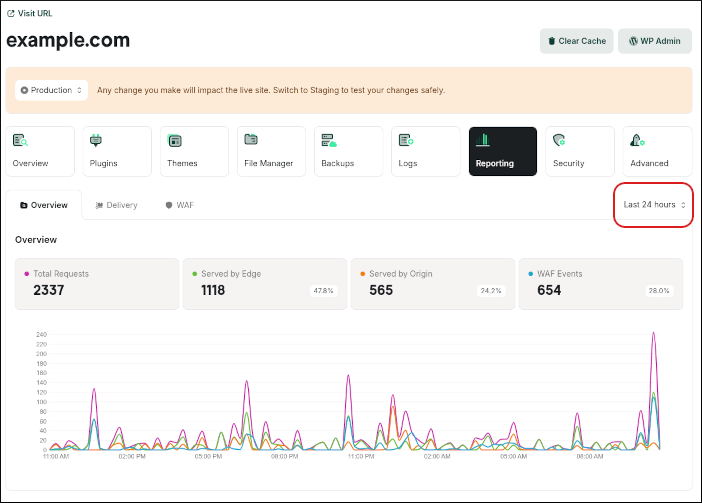
The Overview tab appears, with a summary of information pulled from the Delivery and WAF tabs.
👍 Tip To change the amount of time covered by the reports, at the top right, in the Last 24 hours list box, select the time period you want:
-
For detailed information about your site’s visitors, click the Delivery tab. This tab includes the following sections:
- Delivery: This section shows the number of site visits and where they were served from (Cloudflare Edge or the origin server).
- Cache Status: This section shows detailed information about the cache, including hits and misses.
- Countries: This section shows the top countries where your site visitors are located.
- Top ASNs: This section shows the top ASNs (autonomous system numbers) for your site’s visitors. (An autonomous system, or AS, is a large network or group of networks. For more information about ASNs, go to What is an autonomous system? | What are ASNs? from Cloudflare.)
- Top Browsers: This section shows the top browsers used by your site’s visitors.
- Top Cache Statuses: This section shows the top statistics for your site cache (hit, miss, etc.).
- Top Client IPs: This section shows the top IP addresses of your site visitors.
- Top Colo Codes: This section shows the codes for the top Cloudflare data centers used to serve your site.
- Top Device Types: This section shows the top device types (desktop, mobile, etc.) of your site visitors.
- Top Edge Status Codes: This section shows the top HTTP status codes from Cloudflare Edge.
- Top HTTP Protocol Versions: This section shows the top HTTP protocol versions used.
- Top Hosts: This section shows the top hosts requested by your site’s visitors.
- Top Origin Status Codes: This section shows the top HTTP status codes from the origin server.
- Top Paths: This section shows the top URLs requested by your site’s visitors. To see all paths, click See All.
- Top Referers: This section shows the top HTTP referers from your site’s visitors.
- Top User Agents: This section shows the top browser user agents of your site’s visitors.
Security reporting (WAF) statistics
The hosting.com Dashboard contains statistics about Web Application Firewall (WAF) security events for your site. To view this information, follow these steps:- Log in to the Hosting Panel at https://my.hosting.com.
-
In the left sidebar, click Managed WordPress:
-
On the My Websites page, locate the site, and then click Manage:
-
On the hosting.com dashboard, click the Reporting icon:
-
The Overview tab appears, with a summary of information pulled from the Delivery and WAF tabs.
👍 Tip To change the amount of time covered by the reports, at the top right, in the Last 24 hours list box, select the time period you want:
-
Click the WAF tab. This tab includes the following sections:
- Web Application Firewall: This section shows the total number of events processed by the WAF, and the number of allowed, blocked, and challenged events.
- Events By Type: This section shows information about the types of events processed by the WAF.
- Events by Country: This section shows the top countries where the events originated. To see all countries, click See All.
- Events by IP: This section shows the top IP addresses where the events originated. To see all IP addresses, click See All.
-
Events by Paths: This section shows the top URLs involved in WAF events for your site. To see all paths, click See All.
📘 Note For WordPress, the top path is often xmlrpc.php due to bots probing for weaknesses. Consider disabling XML-RPC for your site if you don’t need it.
- Events by Managed Rules: This section shows the top managed rules involved in WAF events for your site.